Profiling Cocos2d-x Game engine: DS-5 Streamline case study
This article will detail steps on ARM profile cocos2d-x engine and how developers using DS-5 Streamline performance analysis tool to analyze their own mobile applications and improve app performance.
By Bob Peng
1. Introduction
ARM delivers performance analysis tools and open source optimization related projects to help App developers. But few developers know about it.
The Cocos2d-x game engine, one of the world most popular game engines in the world, has more than 25% of global game engine marketing share and 70% marketing share in China. All the most popular mobile games in China are developed using this engine, e.g: Fish joy, I’m MT, big head, etc, and most importantly, all these games run upon ARM-powered devices.
After some investigation and deeply communication with cocos2d-x founders, ARM setup this project to help do performance analysis for this game engine with ARM’s DS-5 Streamline tool. After about 3 months, we do find some hotspots of cocos2d-x and so far we help optimized most of them, and performance improved a lot based on the same benchmarking case, about 30-70% improvement. And the most important, the code patch we submitted already accepted and integrated into the newly released cocos2d-x engine.
This article will show case the detail steps how do ARM profile cocos2d-x engine and how can developers using DS-5 Streamline performance analysis tool to analysis their own mobile applications hence improve app performance.
2. Preparation
DS-5 Streamline tool
Downloading the archive from Arm Developer.
Properly build environment
Please prepare the build environment according to your android source or the instructions described here:
http://source.android.com/source/initializing.html
Android SDK and Platform tools
http://developer.android.com/sdk/exploring.html
These tools will contain the adb command which we will use it to connect the device to host.
Android NDK
http://developer.android.com/tools/sdk/ndk/index.html
This is required by Cocos2d-x for compilation for android platform
Cocos2d-x game engine
You can get the source of cocos2d-x from:
3. DS-5 install and target prepare
ARM Streamline Performance Analyzer is a system-wide visualizer and profiler for ARM powered target running on Linux and Android platforms, which builds on system tracepoints, hardware and software performance counters, sample-based profiling and user annotations to offer a powerful and flexible system analysis environment for software optimization.
3.1 Download and Install DS-5
Please install the DS-5 tools according to the instructions here: http://infocenter.arm.com/help/index.jsp?topic=/com.arm.doc.dui0482k/index.html
3.2 Target device prepare
To use ARM DS-5 Streamline, you need prepare a target device which already enabled DS-5 gator. You can enable any smart phone you want according to:
Or buy a device which our partners already have DS-5 enabled and use it directly
- Device 1: HDMI Dongle (Cortex-A8 + Mali-400)
- Device 2: White-box Tablet (Dual core Cotex A9 + Qual core Mali 400)
Notes: As Application developers, we suggest bug a device directly since it’s hard for you to get Linux kernel source and driver related knowledge to build a DS5 gator driver yourself.
For this project, we are using Spreadtrum sample device which is ARM cotex-A5 single-core CPU and Mali 300 single-core GPU, and we do enable DS5 gator ourselves. After Gator driver and daemon are compiled successfully, we push it to your target, and then start gator with following adb commands:
#adb push gator.ko /system/bin/

#adb push gatord /system/bin/

#adb shell

#chmod 777 /system/bin/gatord

#gatord &
4. Build and install the target profiling applications
In this project, we are using 2 major profiling app: Cocos2d-x official benchmark and the “Fishjoy2” game.
4.1 Build the benchmark application of Cocos2d-x
The benchmark app is stored in the source of Cocos2d-x, named as TestCpp under the “samples” directory, which is the official test suite developed by cocos2d-x team, and we will using those performance related test cases.
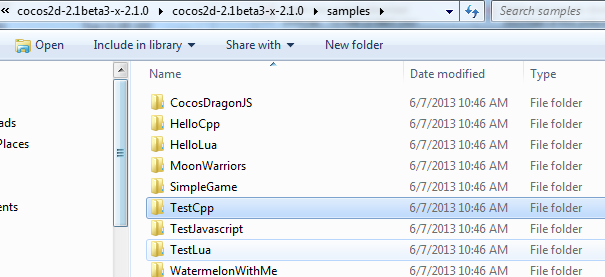
For how to build the TestCpp of Cocos2d-x for android platform, please follow the instructions README.md file under the “samples/Cpp/TestCpp/proj.android” directory.
For convenience, we write below bash script to build it, you refer it if you like.
#!/bin/bash

# put this script in the root directory of cocos2d-x source, and execute it.

# then run it like this: ./build.sh

parent=$(cd $(dirname $0); pwd)

export ANDROID_SERIAL=19761202

export NDK_ROOT=/usr/local/adt-bundle-linux/android-ndk-r8e/

export API_ID="android-17"

android update project -p $parent/cocos2dx/platform/android/java/ -t "${API_ID}"

cd $parent/samples/Cpp/TestCpp/proj.android/

android update project -p . -t "${API_ID}"

./build_native.sh

if [ $? -ne 0 ]; then

    echo "faile to run ./build_native.sh"

    exit 1

fi

ant debug install
4.2 Build the Fishjoy2 application
Per the confidential reason, we can’t get the Fishjoy2 source code, so Fishjoy2 team help build it for us and provide us the apk and .so file with debug info.
Tips:
To make sure the call stack of streamline “call graphic” view works smoothly during the profiling, we suggest add “-fno-omit-frame-pointer“ option when compiling your application, or else it will hard to get the call stack in streamline. Here for the Cocos2d-x application, we can add the following two lines to the file of cocos2dx/Android.mk:
LOCAL_CFLAGS += -fno-omit-frame-pointer
LOCAL_EXPORT_CFLAGS += -fno-omit-frame-pointer
5. Start Streamline profiling
5.1 Connect DS-5 Stremline to target
To use streamline to profile android device, you need connect the android target device to host. Either use Ethernet connect or connect from USB cable and forward the port with below cmd:
#adb forward tcp:8080 tcp:8080
5.2 Configure Streamline
Start DS-5 tool from your PC and open the “Streamline Data” view as below chart show:
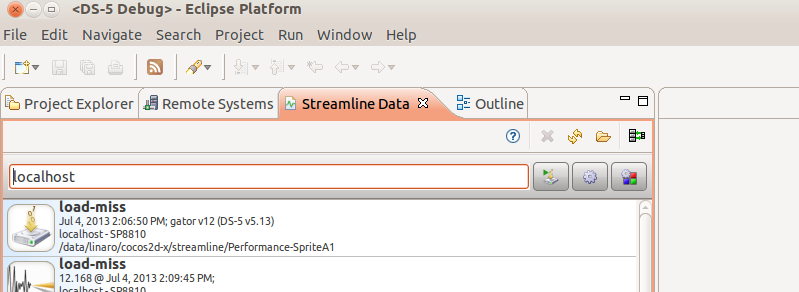
Click the Capture Options button (the gear icon) to open configuration window, and set the configurations as following:
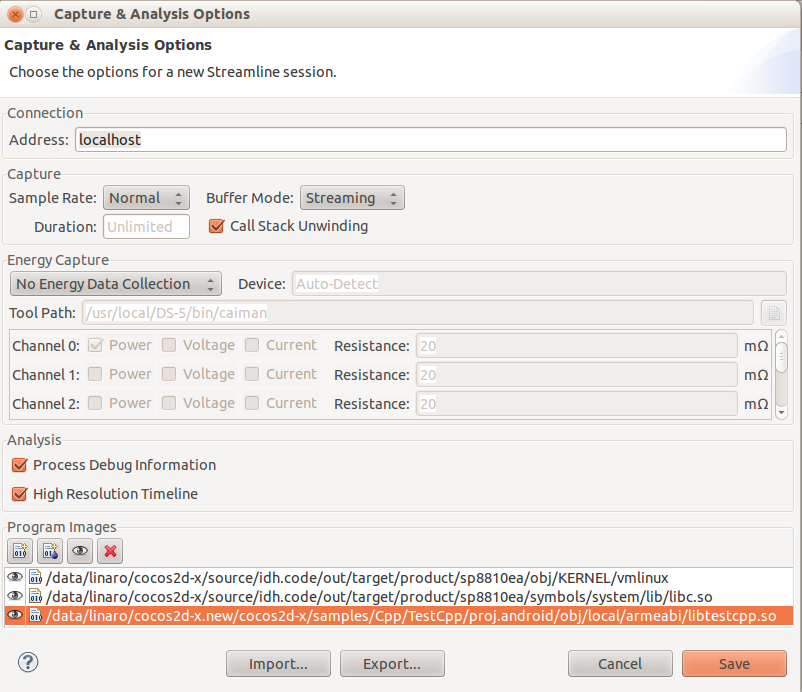
- 1. Connection
- 1.1. Address: localhost
- 2. Capture:
- 2.1. Sample rate: Normal
- 2.2. Buffer mod: Streaming
- 2.3. Duration : Unlimited (leave it blank)
- 2.4. Call Stack Unwinding : checked
- 3. Energy Capture:
- 4. leave them as default
- 5. Analysis:
- 5.1. Process debug Information : checked
- 5.2. High Resolution Timeline : checked
- 6. Program images:
- 6.1. click the first icon to add all necessary symbol files that include the debug information for the library files, normally they are under directories like this:
<android-src-root>/out/target/product/<product>/symbols/system/lib/
- 6.2. add the symbol files of the TestCpp application,
<cocos2d-x-src-root>/samples/Cpp/TestCpp/proj.android/obj/local/armeabi/libtestcpp.so
5.3 Select CPU/GPU related counters you want profiling
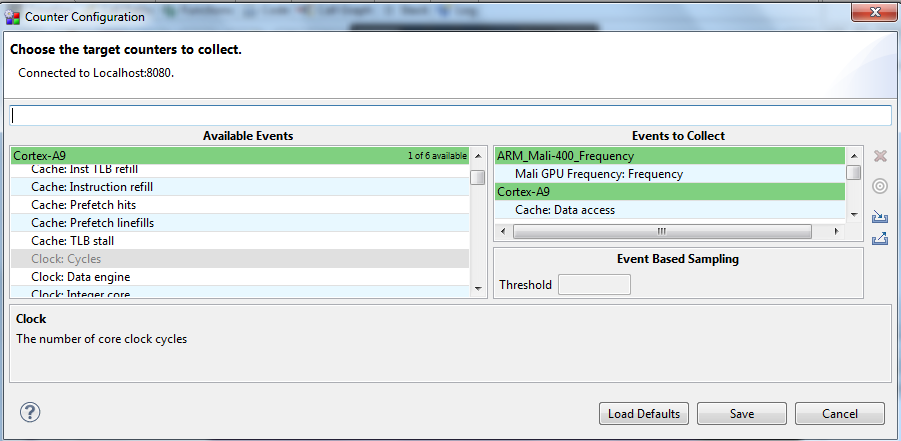
Open the counter configuration tab and select the target counters you would like to check and show in the streamline analysis report, left side is the available counters you can selected, and right side shows the counters you already selected.
5.4 Collect and Check the profiling data
Click the Start Capture button to collect the streamline data. You can see the timer showing how long has collected, normally about 10s will be enough for us to profile and analyze, just click “stop” button when you want to stop the collecting.

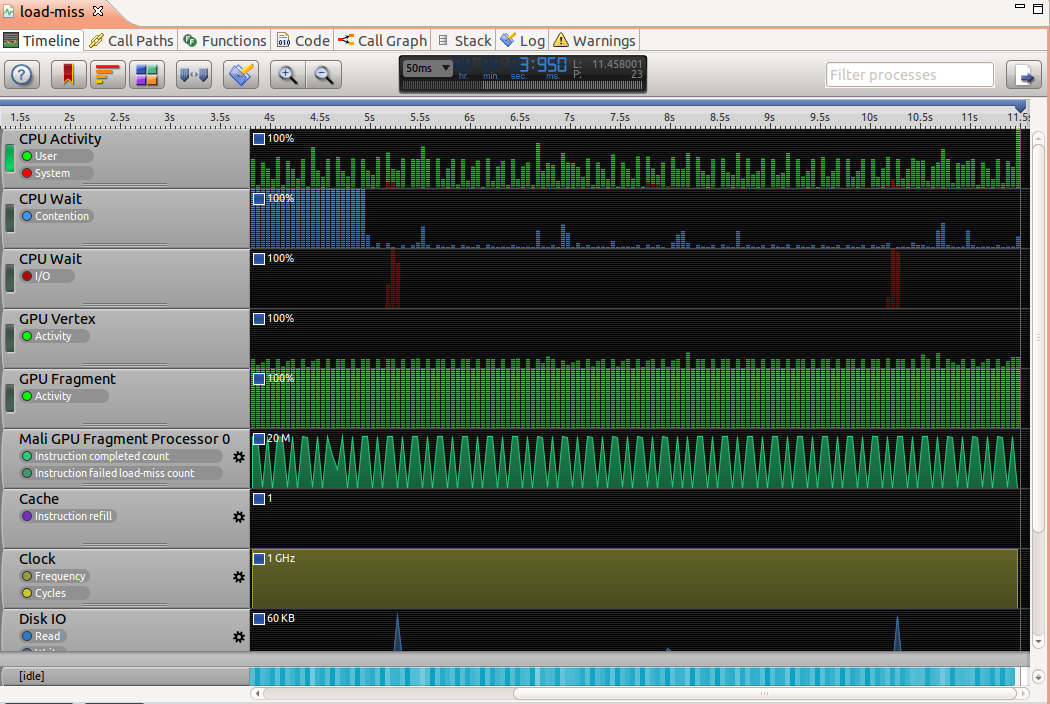
After clicked the Stop button, the streamline analyzer will start automatically, and you will get the following Timeline view opened after the streamline analysis completed. All the counters you selected will be show in the timeline view.
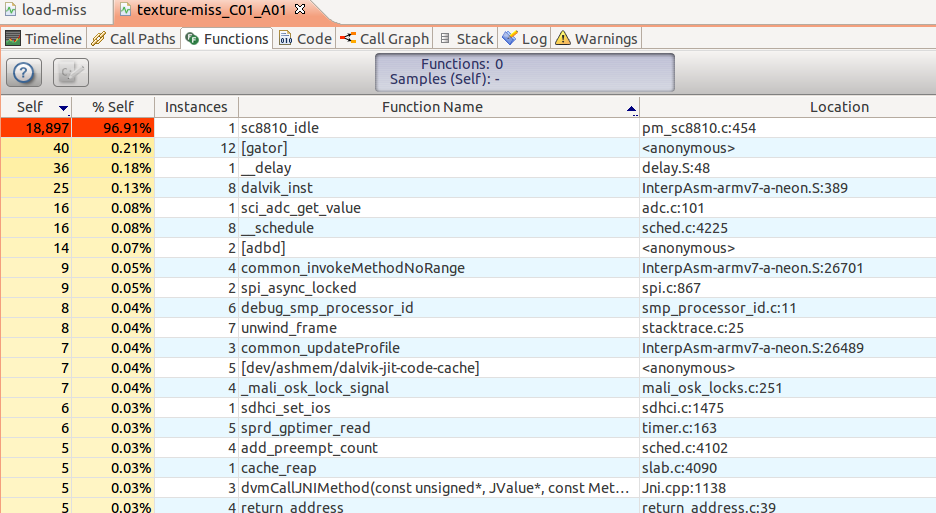
Click to the Functions View, you will see the CPU usage percentage of all the functions. And normally we should check those top CPU usage functions to see whether there are work as design or potential performance issues.
You can reference this link to get more detail information on how to utilize Streamline.
Tips:
If you see there is .so file in the Location column, that meaning you need to add the symbol file to the “Program images” described in 4.2 section.
6. Profiling Stories
6.1 Profiling Story 1-- PerformanceTest NodeChildren B test case
Run the test case:
Start the TestCpp application on the test device and run the test case: PerformanceTest->PerformanceNodeChildrenTest->B Iterate SpriteSheet, click the + button to increase the nodes to 15000, we can see that the FPS is about 11.

Collect profiling data and analyzing it:
Collect profiling data about 10s, from the timeline view profiling report we can see that the CPU is busy, but considering that this case is mainly doing the process of iterating the array, it is almost in the indefinite loop, so the CPU in high percentage should be OK.

Then from the Functions view, we can see that the hotspot is the memcpy function which takes about 50% CPU time.
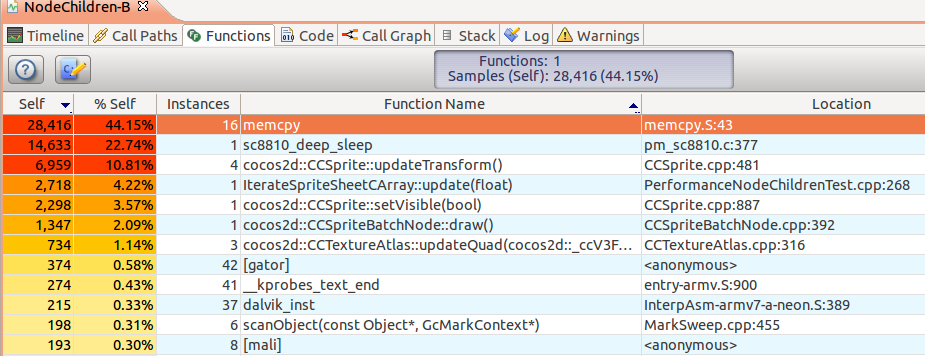
For this memcpy hotspot we checked:
- the memcpy method itself
- the code function who call the memcpy
Go to Streamline “Call Graph” view we found it’s updateQuad method of CCTextureAtlas class who call memcpy continuously.
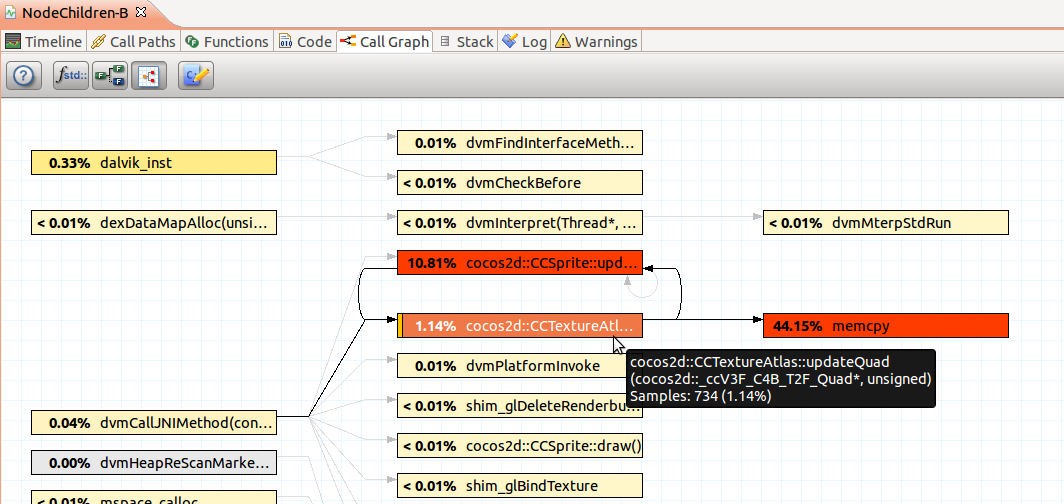
Find the solutions:
- the memcpy method itself
After checking the memcpy implementation, we do find it has been optimized with neon instructions, and there is not much difference with other implementation, e.g, google android implementation and Linaro implementation, meaning no more optimization opportunity, and we’d better check the callers.
- the functions where call the memcpy method
Dig into the source of updateQuad method

We find that there is a ”=” sentence to assign the big struct ccV3F_C4B_T2F, which is 96 Bytes. With the knowledge of android toolchain, we know this assignment will call the memcpy function at runtime.
After investigate the source and some discussion with cocos2d-x engine team, we believe it is possible to use element reference directly in the code where calls this updateQuad method.
For example, changing the following code:
 _textureAtlas->updateQuad(&_quad, _atlasIndex);

to:

quad = &((_textureAtlas->getQuads())[_atlasIndex]);

quad->bl.colors = _quad.bl.colors;
The code patches for this solution are:
https://github.com/cocos2d/cocos2d-x/pull/2652/files
https://github.com/cocos2d/cocos2d-x/pull/2682/files
Optimization result:- CPU time in functions tab(54.62%->9.10%)
The CPU time of memcpy function deduced from 54.62% to 9.10% after optimization
- FPS in screen(11.3 fps->17.2 fps)
The FPS increased from 11.3 to 17.2, performance increased about 70% for this specific case
6.2 Profiling Story 2-- PerformanceTest Sprite A(1) case
Run the test case
Start the TestCpp application on the test device and run the test case: PerformanceTest->PerformanceSpriteTest->A(1) position, click the + button to increase the nodes to 500.

Collect profiling data and analyzing it
Collect profiling about 10s, from the Timeline view we found that so far the CPU is not too busy.
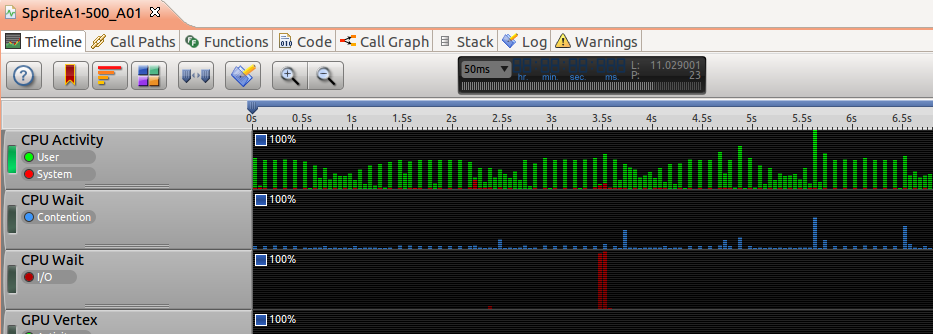
But from the Functions view, idle process(sc8810_idle) takes about 73.43% CPU time.

Based on the experience, we know which meaning the system should be busy, CPU is waiting for something to be completed, like the IO. And in this case, the main IO should be the GPU. So we need check about the GPU status with streamline. This needs the Mali support gator driver module.
For this GPU hotspot we can check from two points based on experience:
- Instruction failed texture-miss count
Open the Counter configuration window and add below two counters to the collection list, save and recapture streamline data
- Mali GPU Fragment Processor 0: Instruction completed count
- Mali GPU Fragment Processor 0: Instruction failed texture-miss count
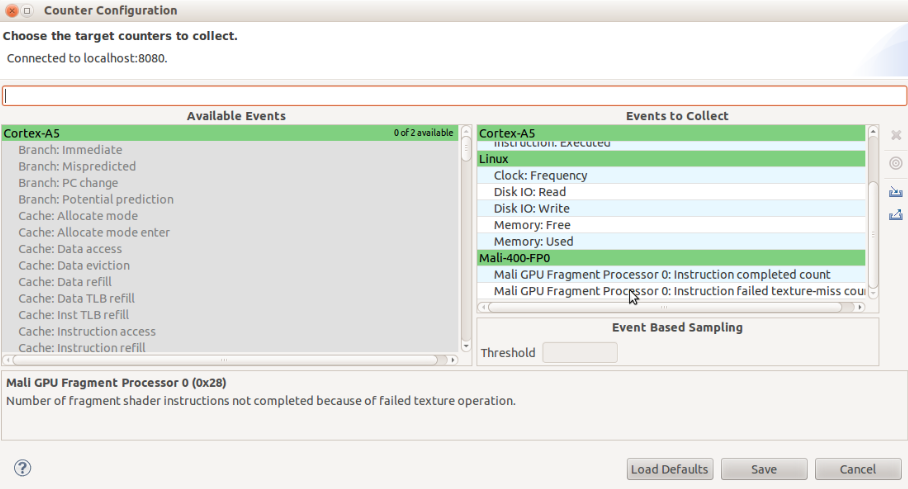
Then we can see that the failed texture-miss count is about 8,030,551, meaning too many instructions are failled to load that texture during fragment shading.
- The overdraw factor
Open the Counter configuration window and add 2 more hardware counters and recapture streamline data
- Mali GPU Fragment Processor 0: Active Clock Cycles
- Mali GPU Fragment Processor 0: Fragment passed z/stencil
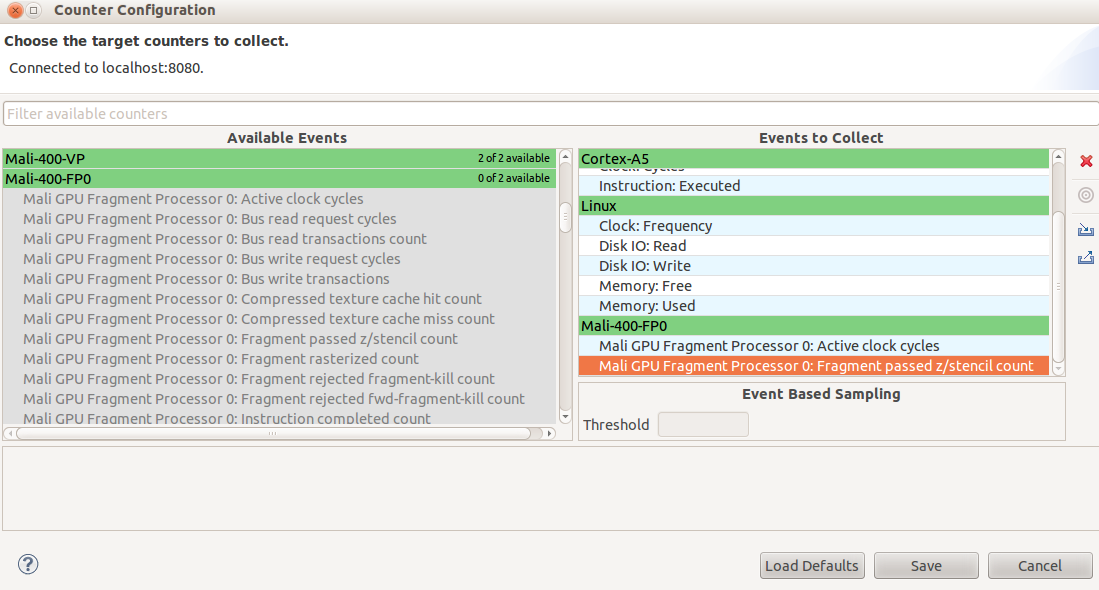
Then we can see that the passed z/stencil count is about 8,573,446
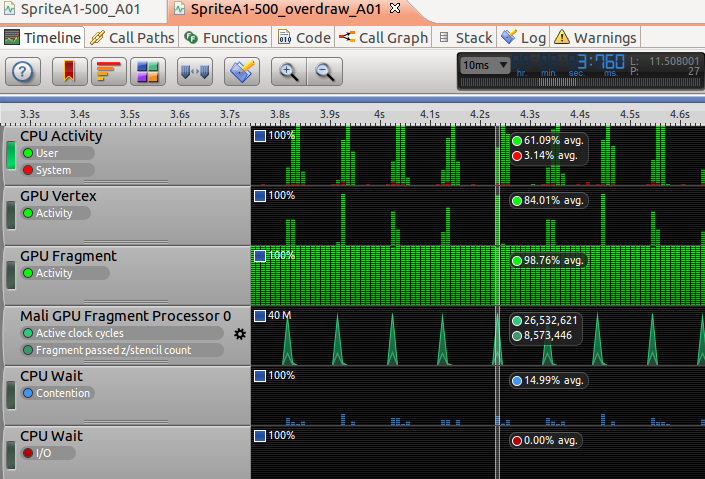
With the overdraw formula, overdraw is about 22.3, which is too high as the overdraw factor for a typical application should be around 3.
overdraw = "Fragments Passed Z/stencil count" / "Device Resolution"
= 8573446/(800*480)
= 22.3
Find the solutions:
- Instruction failed texture-miss count
The cache of the Mali300 of the device we used is only 8K, and it would be the main reason that causing the huge number of texture misses. Per GPU knowledge, using compressing textures technique would help to reduce this misses. Unfortunately, cocos2d-x engine didn’t support compressed texture, after some technical discussion between ARM’s GPU experts and coco2d-x developer team, they finally have ETC1 format supported with the latest engine.
To testing the performance impact with compression texture, we convert the .png file to ETC one and change below code from:
sprite = Sprite::create("Images/grossinis_sister1.png");
to
sprite = Sprite::create("Images/grossinis_sister1.pkm");
Note 1:
ARM provide an tool named Mali GPU Texture Compression Tool to help converting the png file to ETC1 format, you can download it.
With this tool, you can convert the png file to pkm file in ETC1 format with one simple cmd --- “./etcpack grossinis_sister1.png ./ -c etc1”. For more information about how to install and use the Mali GPU Texture Compression Tool, you can refer to link:http://infocenter.arm.com/help/index.jsp?topic=/com.arm.doc.dui0503e/index.html
Note 2:
Cocos2d-x still does not support the Alpha channel for ETC1 format yet, you can reference the following link regarding how to work alpha channel with ETC1 format.
- The overdraw factor
Normally, object drawing sequence will impact overdraw a lot, back->front is the worst case and front->back the best case. After checking with Cocos2d-x team, we was told that all objects have the same Z-order, unfortunately which cause highest overdraw as the worst-case “back->front”. That’s why streamline report show fragment shader cost a lot and fragment GPU is so busy.
Typical ways to reduce overdraw factor is have the app drawing its objects from front to back instead of back to front by having a Z sort at CPU side before submitting geometry to the GPU.
Cocos2d-x team agree with ARM’s proposal but still not support it since it might cause big architecture modification, they need evaluate the side effect. If your profiling report shows the same overdraw issue, please try ARM’s proposal above.
Optimization result:
- Instruction failed texture-miss count (8,030,551->3,081,109, 61.6%)
The failed texture-miss count reduced from 8,030,551 to 3,081,109 after used the ETC1 format.
- FPS in screen(9.3 fps->12 fps 29%)
The FPS changed from 9.3 to 12.0, meaning performance increased about 30% with the ETC format supported.
6.3 Profiling Story 3-- FishJoy2(Start Game)
Run the test case
Firstly, please make sure device connect to internet via wifi, and then start the Fishjoy2 app.

Collect profiling data and analyzing it
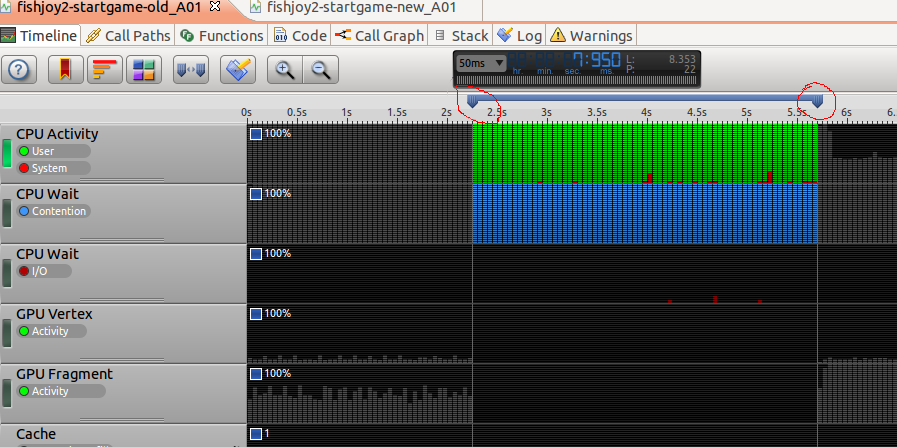
Starting streamline capture by click the “Start Catpure” button, and then click the START button to start playing the game, stopping streamline capture once displayed the scene selection window.
In the timeline view, drag the two blue icons of the time ruler to cover the data for the start operation only. We can see that the START operation cost about 3.5s(2.2->5.7), and the CPU is busy, GPU is idle.
In the Functions view, we can see that the phread_mutex_unclock and pthread_mutex_lock takes 17.22% CPU time(9.51% + 7.71%)
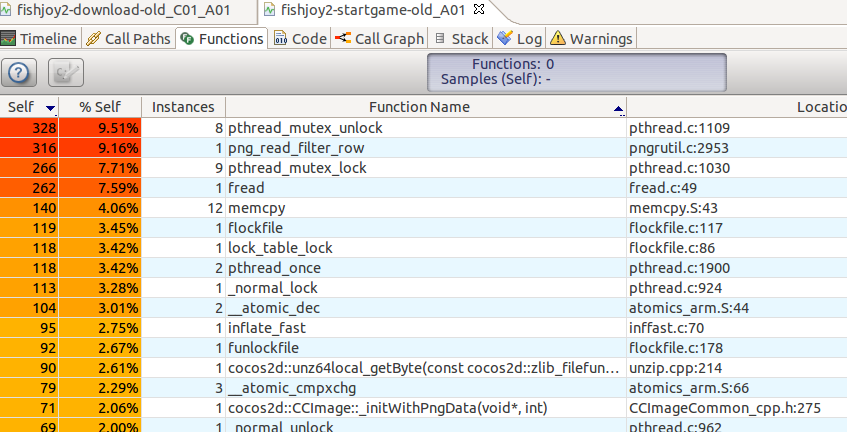
Find the solutions:
After talked with the FishJoy2 team, they confirmed that it’s not expected for the pthread operation to take so much CPU time, they do find some defect of the source code, and fix it.
Optimization result:
- 1. Start time(3.5s->2.5s, 28.6%)
After get the updated APK and recapture streamline report, you will see the start operation time reduced from 3.5s to 2.5s(2.1->4.6)
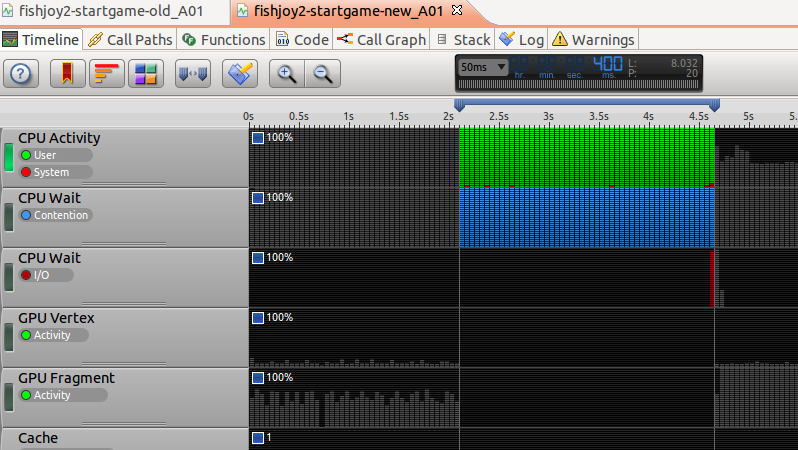
- 2. CPU time(17.22%->12.55%, 27.1%)
And the function view show CPU occupancy rate of pthread operation reduced from 17.22% to 12.55%(7.18% + 5.37%)

6.4 Profiling Story 4-- FishJoy2(Quick click to play the game)
Run the test case
Start the FishJoy2 Application, and play the ame about one minute
Collect profiling data and analyzing it:
Capture the streamline data about 30s, you will see the Timeview profiling report show fragment GPU is very busy.
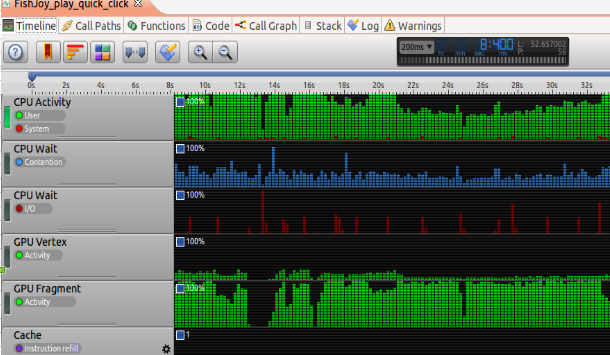
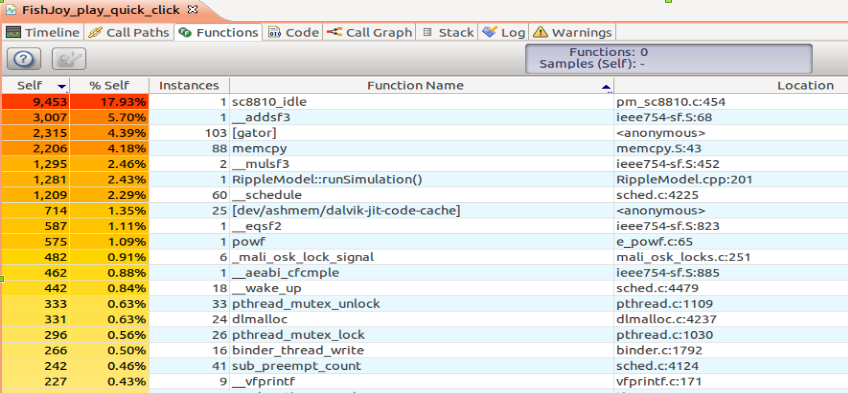
The Functions view show the idle process takes up the highest CPU time. And we can also see that there are many float related system calls takes higher CPU time, eg: the _addsf3/mulsf3/eqsf2
Find the solutions:
For the idle process and the high usage of GPU processor, we already know that this is the same problem with the Profiling Story 2 we met.
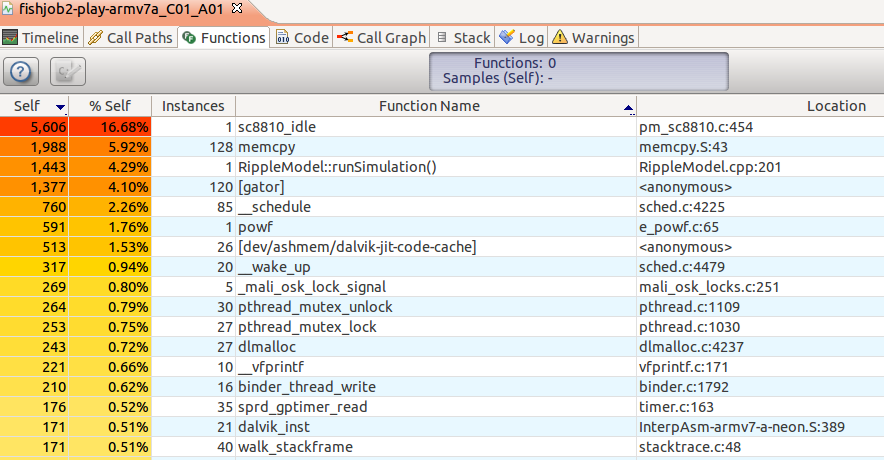
For many float related operation system calls taking higher CPU time, which is abnormal since ARM already optimized this kind of functionalities, after some discussion with Fishjoy2 team, we finally find that this game is compiled with the armeabi ABI, not with the armv7a ABI. We suggest fishjoy2 team recompile apk with armeabi-v7a option enabled as below code show:
$ cat samples/Cpp/TestCpp/proj.android/jni/Application.mk

APP_STL := gnustl_static

APP_CPPFLAGS := -frtti -DCC_ENABLE_CHIPMUNK_INTEGRATION=1 -DCOCOS2D_DEBUG=1 -std=c++11

NDK_TOOLCHAIN_VERSION=4.7

APP_ABI := armeabi-v7a

$
Optimization result:
After compiled the game with armv7a ABI, we can see that the float related operations disappeared in the higher CPU time occupancy list.
7. Conclusion
The cocos2d-x profiling project we have done do demonstrate that ARM Streamline is a very powerful tool to help application developers doing performance analysis, finding application hotspots and then optimizing their applications. And the project output so far is very positive, not only help finding cocos2d-x game engine’s code logic related hotspots, but also finding some design architecture related potential limitations.
Cocos2d-x team do thanks ARM at their official SNS account –sina weibo/twitter/facebook—for all our effort, especially the code patch we submitted, which they think will benefit the whole cocos2d-x community. Meanwhile, cocos2d-x team engineers are starting using DS-5 Streamline to profile their latest engine themselves.
At the end, we would like to share to all the developers that some Chinese key mobile internet app companies are starting using ARM DS-5 Steamline to do performance analysis themselves now, like: Ucweb, tencent and alibaba.
By Bob Peng
Re-use is only permitted for informational and non-commerical or personal use only.


