How to debug: CoreSight basics (Part 3)
This is the third in a series of blogs that gives a technical introduction to the ARM CoreSight Debug and Trace technology and architecture.
By Eoin McCann

This is the third in a series of blogs that gives a technical introduction to the ARM CoreSight Debug and Trace technology and architecture. You can check out my previous blogs How to debug: CoreSight basics (Part 1) and How to debug: CoreSight basics (Part 2) to find out the full story.
Typical CoreSight systems
The systems shown here demonstrate the most basic configurations of a CoreSight system. More complex systems might involve clusters of processors, multiple clock domains, etc.
Single processor debug
Figure 1 shows CoreSight debug in a single processor system.
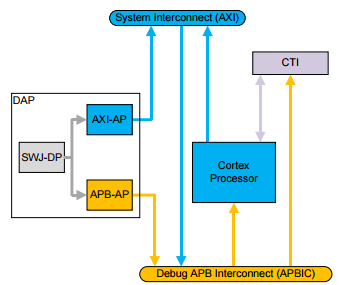
Figure 1. Single processor with Debug APB access
This configuration provides no trace capabilities. The DAP shown here is configured with a combined Serial Wire and JTAG external interface, and APB internal debug access. The Debug APB connects using an APB-Interconnect to configure the CTI and access the processor. The CTI supports triggering of the processor from a designated resource, and enables connection to additional triggering resources if this example is integrated into a larger system.
Single source trace
Figure 2 shows a single processor trace using the CoreSight infrastructure.
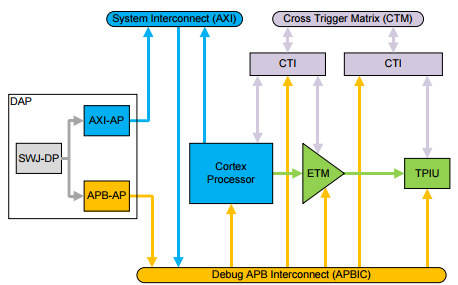
Figure 2. Single source trace with the TPIU
The CoreSight-compliant ETM trace unit outputs trace directly to a TPIU for direct output of trace off-chip. You can extend this system to add a CoreSight ETB and replicator to provide on-chip storage of trace data.
Multi source trace in a single processor system
Figure 3 shows full trace capabilities in a single processor system.
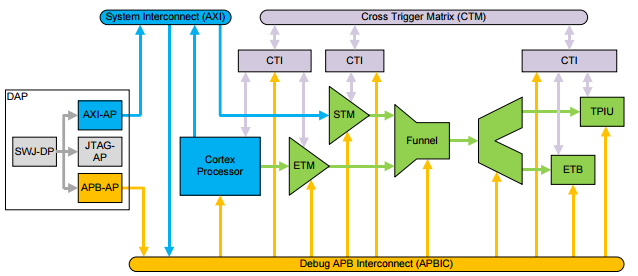
Figure 3. Full CoreSight trace with single processor
The ETM trace unit provides processor instruction and data tracing, and the STM provides instrumentation trace. The trace funnel combines trace from all sources into a single trace stream. This is then either:
- Replicated to provide on-chip storage using the CoreSight ETB (limited capacity)
- Output off chip using the TPIU (limited bandwidth)
You can program components using the DAP and operate cross-triggering using the CTM and CTIs.
When multiple trace sources are active in the system, each source must be configured with a unique trace source ID, and every trace sink must have trace formatting enabled. One function of the trace formatter is to embed the trace IDs in the final data stream. When only one trace source is active, the trace sink can be used in bypass mode which can be more efficient in some scenarios.
System topology restrictions
The CoreSight architecture includes some rules which restrict the system topology. These rules allow for system-agnostic debug tool design and topology detection. Violating the topology rules might also result in deadlock or livelock conditions.
Some rules relate to the debug memory map, which is limited to any path from external interface to peripheral only crossing 3 levels of protocol addressing (external interface, subset of debug interconnect, address within interconnect) and this addressing not having any replication or aliasing. Restrictions on the trace bus require no duplication or re-use of any trace ID which reaches any other trace component, or feed any trace source back in a feedback loop.
Trace Capture
The trace that CoreSight trace sources generate must be captured by one or more Trace Capture Devices (TCDs). The following common forms of TCD exist:
- On-chip trace buffer
- Off-chip logic analyzer
- Off-chip dedicated Trace Port Analyzer
Logic analyzers are expensive and are less well supported by development tools, but can often capture trace at higher speeds than is possible with a Trace Port Analyzer (TPA). Most developers capture trace using a TPA or on-chip trace buffer.
The CoreSight ETB and Embedded Trace Router (ETR) are ATB slaves and connect to the CoreSight system directly to enable capture of trace data on-chip. A TPA, or logic analyzer, must connect to the pins of a trace port that a TPIU drives.
Many systems implement either one ETB or one TPIU. However, it is possible to implement multiple trace sink components using a CoreSight Replicator.
Figure 4 shows a system that implements an ETB and a TPIU connected to a TPA.
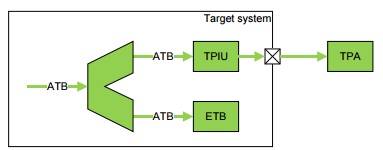
Figure 4. Example system with ETB and TPIU 5.1.1 Operation of a TCD
A TCD has a large circular buffer at its center. Trace is written into this buffer as it is generated. Trace capture does not stop when the buffer becomes full, but instead overwrites old trace.
A TCD is sensitive to two special signals, that the ETB or TPIU generate:
- Trigger
- Trace disabled
A TPIU indicates these signals to a TCD as follows:
- Using the optional TRACECTL top level pin. This is the easiest way for a TCD to detect this information, but requires a dedicated pin when trace is in use.
- Using the CoreSight formatter protocol. This requires a TCD that can extract this information from the formatter protocol, and results in a trace port that is one pin smaller. There is a protocol overhead cost (at least 6%), but this is offset by freeing up one more pin. The formatting protocol also permits the use of more than one enabled trace source at a time.
Trigger
The trigger is an input to the trace sink, and an output from a CTI. If there is more than one trace sink, each can receive a different condition as its trigger. Most trace sources, for example an ETM trace unit or AHB Trace Macrocell (HTM), can output a signal to use as a trigger. Usually, the CTIs are configured to send a trigger to all trace sinks when any trace source signals its trigger condition.
When a trigger is detected, the TCD counts a programmable number of trace records before it stops trace capture. After this point, it ignores any more trace. By setting the appropriate number of programmable trace records, you can select a window of trace to capture around the trigger condition. Figure 5 shows this context.
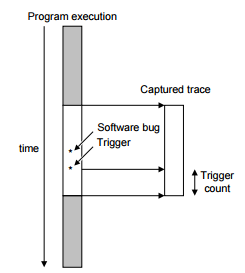
Figure 5. Use of the trigger to set a trace window
You can configure the trigger to output when the system detects a bug. The window of trace indicates the behavior of the system before and after the bug occurred.
You can use the trigger count in the following ways:
- Set the trigger count to a small value. This gives a window of trace mostly before the trigger occurred, capturing the software bug under investigation.
- Set the trigger count to a value slightly smaller than the size of the buffer. This gives a window of trace mostly after the trigger occurred.
- Set the trigger count to roughly half the size of the buffer. This gives a window of trace before and after the trigger occurred.
When trace capture has stopped, the development tools download the trace from the TCD.
Trace disabled
Trace disabled indicates to the TCD that there is no trace to capture. It ensures that the values of the trace port pins are only captured when trace data is available. The formatting protocol can also indicate that there is no data to be captured by using a specific sequence, but again this requires on the TCD being able to perform some analysis of the stream before it is captured.
Streaming Trace Capture
Usually, the ETB, ETR, or TPIU wait until there is sufficient trace to use all the pins of the trace port before any trace is captured in the on-chip memory or output over the trace port. For example, if only one byte of trace is available in a system that implements a 16-bit trace port, no trace is output until a second byte of trace is available. In addition, when the formatting protocol is in use, a full block of 16 bytes must be captured before the data can be fully decompressed. This complicates the task of designing a trace capture system where data must be continuously streamed and analyzed in near real time. Different approaches to this problem can be used depending on the system requirements, and are unlikely to detract from the user experience when streaming trace is expected.
Trace Capture Capacity
A trace capture system is likely to be one of the limiting factors determining how much trace can be generated. The resources dedicated to trace capture are likely to be limited, and it is important to ensure that the typical use-cases can be supported with a low enough level of data loss. Although CoreSight is designed with graceful degradation in the case that more trace is generated than can be captured, this should not be relied on. Careful use of filtering will result in more useful trace being captured than relying too much on the overflow/recovery behavior.
The demands of a trace source can vary greatly, an ETM trace unit might produce between 1 bit per instruction for instruction only trace, or over 30 bits per instruction when tracing instructions and data. Even if the data to be traced can be filtered, this might not help much for short-term bursts of data so an on chip trace FIFO can help. For more complex trace systems, this becomes more of a cost-effective solution as the resource added is shared between more of the trace logic. The user can select which trace source needs most bandwidth, but still enable a smaller amount of trace from several other sources, or use the other sources as triggering resources.
Trace Synchronization
Most trace sources use complex protocols which rely not only on identifying the correct packet boundaries in the protocol, but also initializing the various decompression schemes. When the trace capture formatter protocol is in use (as is necessary for simultaneous capture from more than one source), the formatter protocol requires synchronization too.
A TPA will typically capture trace into a circular buffer. This means that if capture is stopped once the buffer has wrapped round, some early trace will have been lost. In order to decompress the trace stream, the tools must search the buffer until a synchronization point can be detected. Any trace which was captured but is before the synchronization point must be discarded (usually the synchronization cannot be extended backwards). Since it is inefficient to synchronize each trace stream too frequently, most trace sources allow for software programming of the synchronization points.
Depending on the quantity of trace being captured, it might be necessary to change the synchronization period. When capturing into a small buffer, more frequent synchronization results in a higher proportion of the captured trace being usable (but more use of the buffer for non-useful trace).
In systems where several trace sources are active together, the synchronization of each source is independent. Some trace sources support the use of a distributed synchronization request to be generated from the TCD. This ensures that all trace sources initiate their synchronization sequences at the same time.
Timestamps
Many trace sources can embed global (SoC level) timestamps in their trace stream. These can be used to correlate activity between different traces sources, particularly when the trace data might be captured in different TPAs, or subject to delays as a result of protocol or buffering.
Timestamps are typically a 64 bit count, derived from an always on domain with a frequency of at least 10 MHz. The timestamp distribution mechanism uses a narrow bus to distribute this count value, and an interpolation mechanism to generate corresponding count values at higher resolutions where the count needs to be used. This provides a trade-off where the ordering between events in a well designed system can be determined, at least to the accuracy of any communication between the CPUs originating the events. Timestamps can also be used for performance measurement, as an alternative to the more precise but more bandwidth intensive cycle counts which some trace sources can insert.
Thank you for reading this blog. You can find out more about CoreSight Debug and Trace technology on the ARM Developer website below.
By Eoin McCann
Re-use is only permitted for informational and non-commercial or personal use only.
